Install & Use Glances on Ubuntu Server via GitHub (pipx) with FastAPI Web UI & systemd Service.
Familiar with top and htop? If you want a more powerful, flexible, and user-friendly system monitor, Glances is a strong upgrade—offering deeper insights with minimal overhead. 🚀


Glances is a powerful, cross-platform CLI monitoring tool that delivers a real-time, holistic view of system performance. Beyond what top and htop offer, it surfaces rich metrics—CPU, memory, disk I/O, network, filesystems, sensors, and even containers—in a single interface.
Its ncurses-based UI prioritizes clarity and speed, enabling rapid health assessment and deeper diagnostics. With a built-in web server, Glances also supports remote monitoring from any browser, making it highly versatile for both local and distributed environments.
Why use pipx + FastAPI?
pipx ensures a clean, conflict-free installation by isolating Glances in its own environment—avoiding “externally-managed-environment” errors on modern Linux. It keeps your system Python intact while making glances globally accessible, with simple lifecycle management (pipx install / pipx uninstall).
FastAPI, now standard in Glances (≥ 4.5.2), powers a faster and more modern web UI. It delivers better performance than the legacy Bottle backend and includes built-in API documentation accessible via /docs, making monitoring and integration far more efficient.
Step 1: Install pipx
On Debian/Ubuntu-based distributions, install the required dependencies with:
# Install pipx
$ sudo apt update
$ sudo apt install pipx -y

# Add to PATH
$ pipx ensurepath

# Reload shell
$ source ~/.zshrc
or
$ souce ~/.bashrc
Step 2: Download Glances (e.g., v4.5.2) from GitHub
# Note: Replace with the latest version from https://github.com/nicolargo/glances/releases
# Download the specific version
$ wget https://github.com/nicolargo/glances/archive/refs/tags/v4.5.2.tar.gz

# Extract
$ tar -xzf v4.5.2.tar.gz

# Enter directory
$ cd glances-4.5.2
Step 3: Install with pipx
pipx ensures a clean, conflict-free installation by isolating Glances in its own environment—avoiding “externally-managed-environment” errors on modern Linux. It keeps your system Python intact while making glances globally accessible, with simple lifecycle management (pipx install / pipx uninstall).
# Install from local directory with all features
$ pipx install . --force

# Or install directly from GitHub URL
# $ pipx install https://github.com/nicolargo/glances/archive/refs/tags/v4.5.2.tar.gz
Step 4: Inject web dependencies (FastAPI)
FastAPI, now standard in Glances (≥ 4.5.2), powers a faster and more modern web UI. It delivers better performance than the legacy Bottle backend and includes built-in API documentation accessible via /docs, making monitoring and integration far more efficient.
# Add FastAPI and all web requirements
$ pipx inject glances 'glances[web]'

# Verify installation
$ pipx runpip glances list | grep -E "fastapi|uvicorn|jinja2"
# Should show: fastapi, uvicorn, jinja2, etc.
Step 5: Test manually
# Test web mode (Ctrl+C to stop)
$ glances --webserver --bind 0.0.0.0 --port 61208

# In another terminal, test connection
$ curl http://localhost:61208
# Should return HTML
Step 6: Create systemd service
Find your username
$ echo "Your username is: $USER"
$ echo "Home path: $HOME"
Create service file
$ sudo nano /etc/systemd/system/glances.serviceCopy this EXACT configuration (replace YOUR_USERNAME with your actual username):
[Unit]
Description=Glances Web Server
After=network.target

[Service]
Type=simple
User=YOUR_USERNAME
Group=YOUR_USERNAME
ExecStart=/home/YOUR_USERNAME/.local/bin/glances --webserver --bind 0.0.0.0 --port 61208
Restart=on-failure
RestartSec=5
WorkingDirectory=/home/YOUR_USERNAME
Environment=HOME=/home/YOUR_USERNAME
Environment=USER=YOUR_USERNAME
Environment=PATH=/home/YOUR_USERNAME/.local/bin:/usr/local/bin:/usr/bin:/bin
Environment=PYTHONPATH=/home/YOUR_USERNAME/.local/share/pipx/venvs/glances/lib/python3.12/site-packages

[Install]
WantedBy=multi-user.target
Step 7: Enable and start service
# Reload systemd
$ sudo systemctl daemon-reload

# Enable to start on boot
$ sudo systemctl enable glances

# Start the service
$ sudo systemctl start glances

# Check status
$ sudo systemctl status glances
Step 8: Verify it's working
# Check if port is listening
$ ss -tlnp | grep 61208

# Test locally
$ curl http://localhost:61208

# View logs if needed
$ sudo journalctl -u glances -f
Step 9: Firewall (if accessing remotely)
# Allow port 61208
$ sudo ufw allow 61208/tcp

# Check firewall status
$ sudo ufw status
Step 10: Access Glances web UI
- Local: http://localhost:61208
- Remote: http://YOUR_SERVER_IP:61208
- API docs: http://localhost:61208/docs
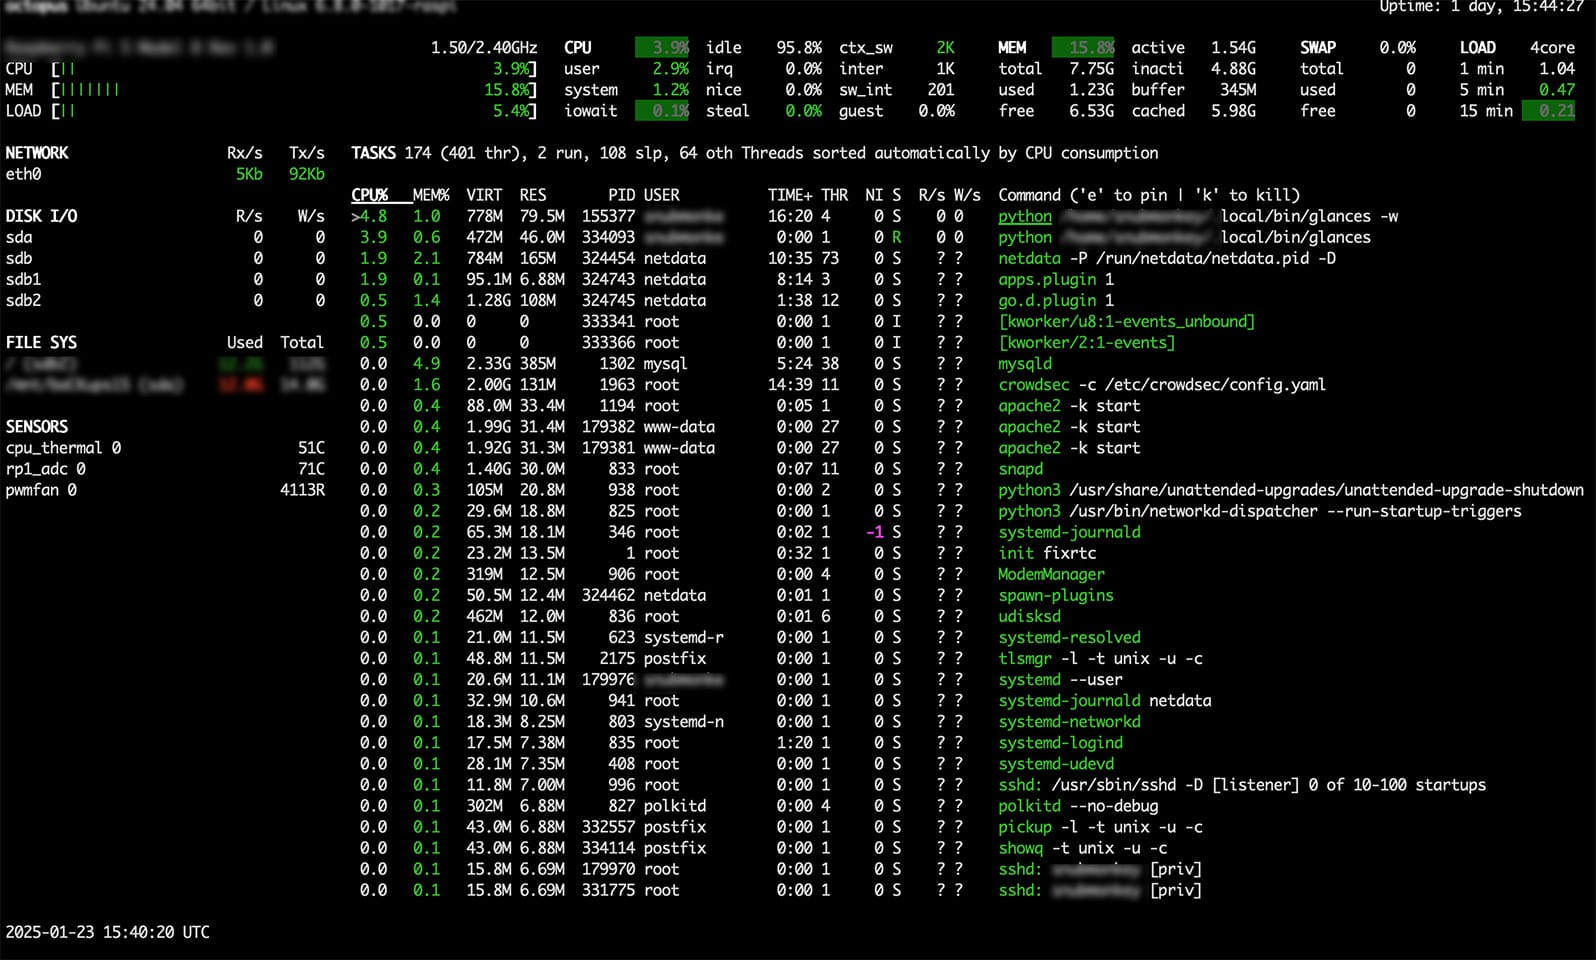
You should now see detailed system information, similar to the example below:
Glances Shortcuts & Interactive Help: Boost Your Monitoring Efficiency
While Glances is running, press h to open the interactive help screen and explore all key bindings and features.
Quick examples:
- Press
c→ sort processes by CPU usage (find resource hogs fast) - Press
m→ sort by memory usage (spot leaks or heavy apps) - Press
f→ toggle filesystem view (check disk usage instantly)
Glances Built-in Authentication
Method 1: Interactive Password Entry (Recommended)
Add a layer of security to your Glances web interface with username/password protection.
To set a password, run the following command:
# Start web server with username/prompt
$ glances -w --username

# It will prompt:
# Enter password:
# Confirm password:
Method 2: Password File (Best for services)
# Create password file
echo "admin:YourPassword123" > ~/.config/glances/glances.passwd

# Set proper permission
$ chmod 600 ~/.config/glances/glances.passwd

# Start with password file
$ glances -w --username --password-file ~/.config/glances/glances.passwd
For Your systemd Service
Correct service configuration:
[Service]
...
..
# ... other settings ...
ExecStart=/home/YOUR_USERNAME/.local/bin/glances --webserver --bind 0.0.0.0 --port 61208 --username --password-file /home/YOUR_USERNAME/.config/glances/glances.passwd
We hope you found these insights useful! Glances offers powerful, real-time system monitoring, making it easy to track and manage your system's performance! 🚀